Urban Mobility Synthesis
Synthesizing travel surveys with prompted and fine-tuned LLMs
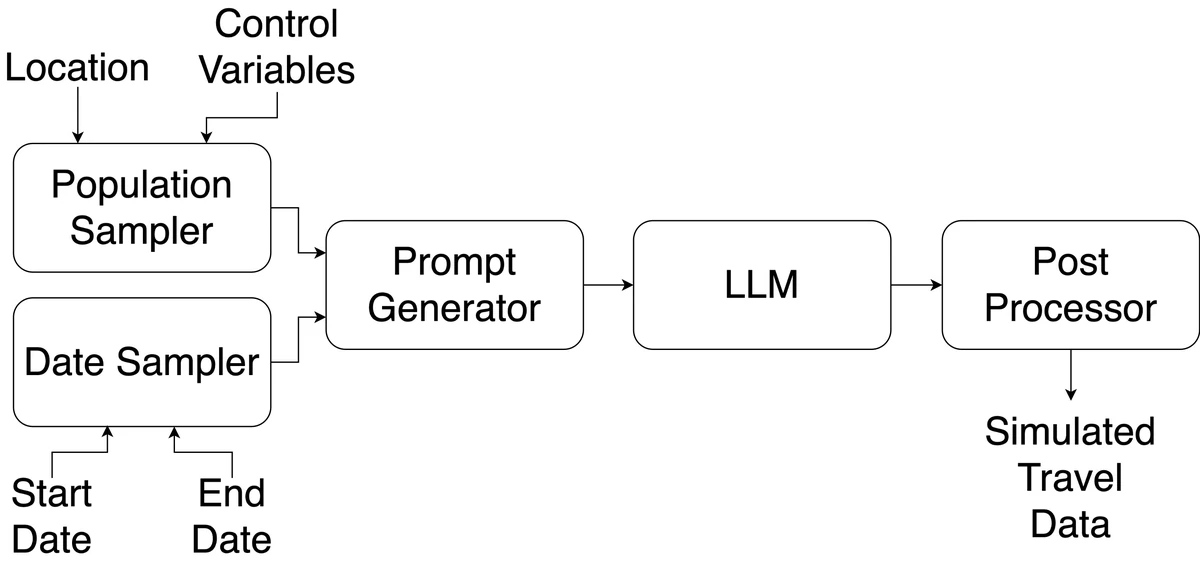
Travel surveys such as the U.S. National Household Travel Survey (NHTS) tell planners where people go over a day, but they are expensive, slow and privacy-sensitive, and few people answer them: the 2017 NHTS had a response rate of 15.6%. We asked whether a large language model can take the participant’s place. Describe a person using census statistics, give a date, and let the model fill in that day’s travel diary. Repeat for thousands of people and you have a synthetic travel survey.
The approach was introduced at ACM SIGSPATIAL 2024, where it received the Best Paper Award, and extended in ACM Transactions on Spatial Algorithms and Systems (TSAS) with newer models, age-balanced fine-tuning and a test of seasonal behavior.
From prompt to diary
The prompt reads like the instructions a survey participant receives. The person, place and date (highlighted) change for every sample:
The individual is a 59-year-old female whose racial background is
"White alone". Currently, she is not enrolled in school and is
participating in the labor force. She is employed and working in the
"Business and financial operations occupations" field. […] She lives in
San Francisco, CA. She has been selected for a travel survey and has recorded
her travel logs for 2016-05-05 which is a Thursday. […]

| Place Visited | Arrival Time | Departure Time | Location Type |
|---------------|--------------|----------------|---------------|
| [Place Name]  | [HH:MM AM/PM] | [HH:MM AM/PM] | [Location Type] |

She was reminded of the following:
1. Ensure that "Home" is included in the list if it was part of
   travel activities on the specified date. […]

For the "Location Type," she was instructed to use the corresponding
code from the provided list:
1: Regular home activities (chores, sleep)
3: Work
11: Buy goods (groceries, clothes, appliances, gas)
13: Buy meals (go out for a meal, snack, carry-out)
… 20 codes in total

The table she created is as follows:
| Place visited | Arrival | Departure | Type |
|---|---|---|---|
| Home | 00:00 AM | 07:30 AM | 1 |
| Work | 08:00 AM | 05:00 PM | 3 |
| Home | 05:30 PM | 11:59 PM | 1 |
Activity chain:  Home → Work → Home
Travel time:     1 h (the gaps between rows)
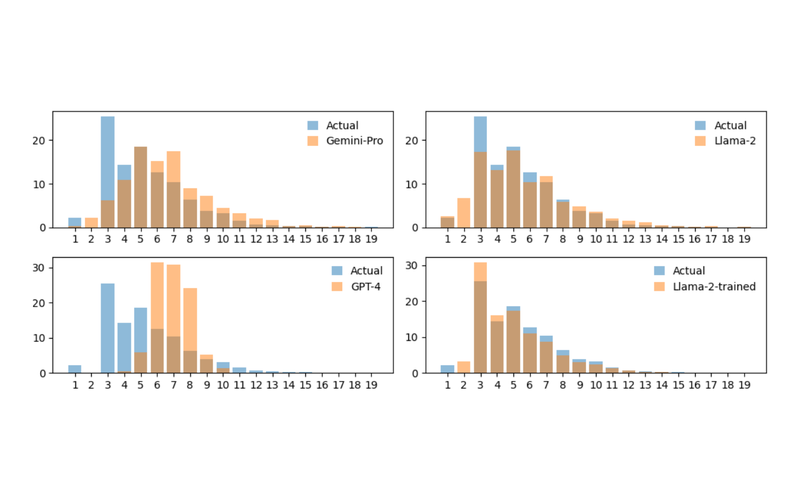
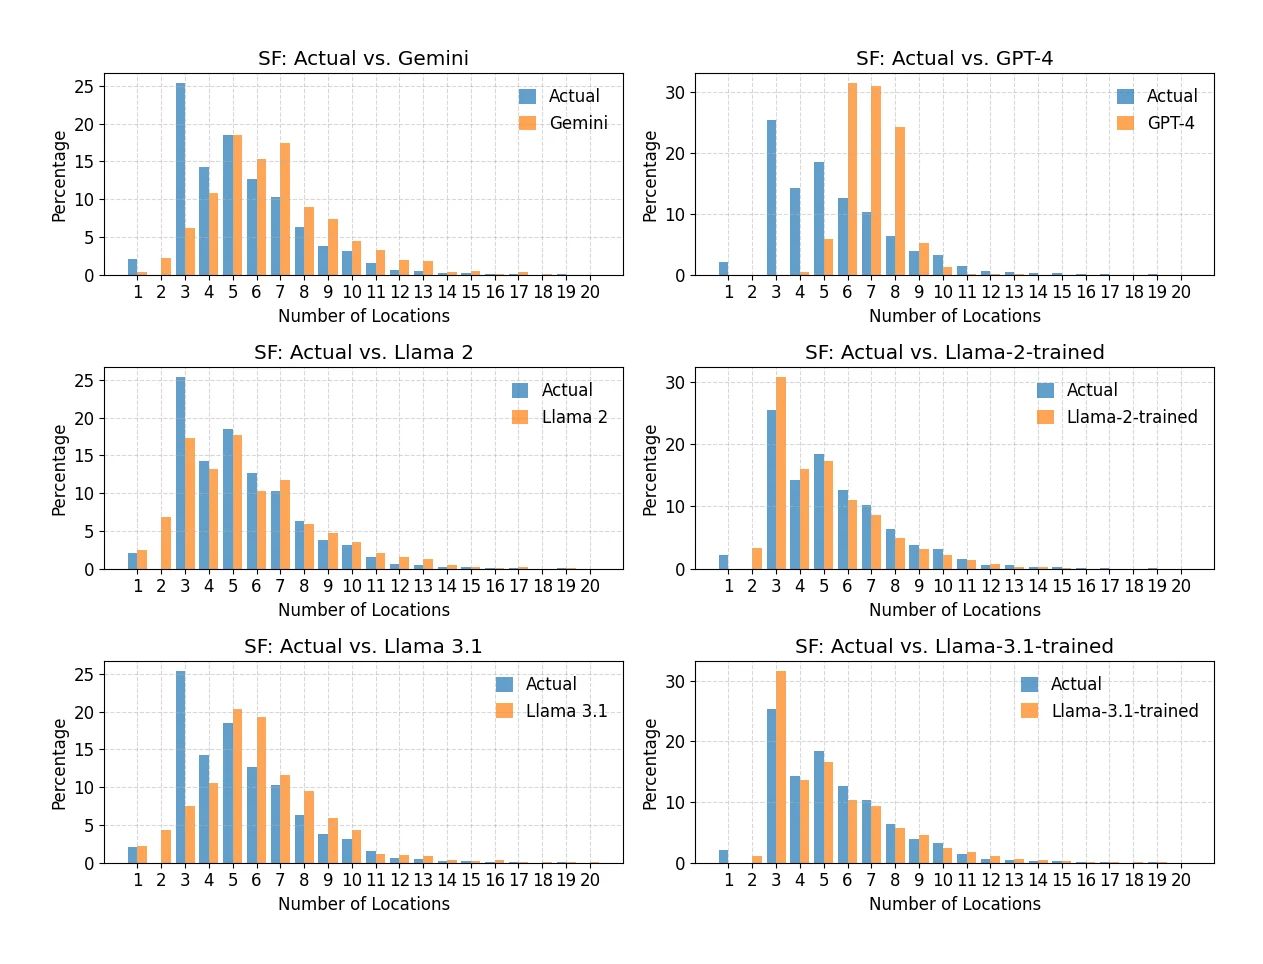
We compare prompted models (Gemini-Pro, GPT-4, Llama-2, Llama-3.1) with Llama-2 and Llama-3.1 fine-tuned with LoRA on 10,000 anonymized NHTS diaries, and evaluate at three levels: daily patterns (places visited, travel time), trips (transitions between activity types) and complete daily activity chains.
Results in San Francisco
| Model | Places / day | Travel h / day | Transition error ↓ | Chain overlap % ↑ |
|---|---|---|---|---|
| Real survey (NHTS 2017) | 5.35 | 1.74 | – | – |
| Prompted | ||||
| Gemini-Pro | 6.59 | 2.52 | 0.063 | 17.25 |
| GPT-4 | 6.96 | 2.52 | 0.166 | 1.44 |
| Llama-2 | 5.55 | 7.17 | 0.106 | 25.42 |
| Llama-3.1 | 6.05 | 3.52 | 0.103 | 13.96 |
| Fine-tuned on 10,000 diaries | ||||
| Llama-2-trained | 4.97 | 1.53 | 0.044 | 42.54 |
| Llama-3.1-trained | 5.29 | 1.52 | 0.041 | 43.74 |
San Francisco–Oakland–Hayward, from Tables 5–7 of the TSAS paper; closest to the real survey highlighted. Transition error is the Frobenius norm between real and generated first-order transition matrices; chain overlap is the frequency-weighted overlap between real and generated daily activity chains.
Prompted models know roughly what a day looks like but exaggerate it, visiting too many places and, in Llama-2’s case, traveling for hours. After fine-tuning, both open models land close to the real survey on every measure. Generated chains that never appear in the real data are mostly near misses: for the fine-tuned Llama-3.1, 63% of them are a single edit away from a real chain.
Other cities
The same models generate surveys for four more metropolitan areas. Weighted overlap of daily activity chains with each city’s real survey:
| Metro area | Gemini-Pro | GPT-4 | Llama-2 | Llama-2-trained | Llama-3.1-trained |
|---|---|---|---|---|---|
| Washington–Arlington–Alexandria | 18.89 | 2.7 | 26.58 | 40.15 | 41.56 |
| Los Angeles–Long Beach–Anaheim | 17.22 | 1.51 | 27.29 | 43.12 | 42.62 |
| Dallas–Fort Worth–Arlington | 18.4 | 2.04 | 28.18 | 44.42 | 51.47 |
| Minneapolis–St. Paul–Bloomington | 16.99 | 2.27 | 24.44 | 45.84 | 43.06 |
Weighted chain overlap in %, higher is better (TSAS Table 8).
Local survey data is not required. A Llama-2 model fine-tuned with all five study metros removed from its training data performs almost the same in San Francisco (4.79 vs 4.97 places per day, 1.60 vs 1.53 hours of travel), so the method can produce surveys for places that have none.
Getting the details right: age and seasons
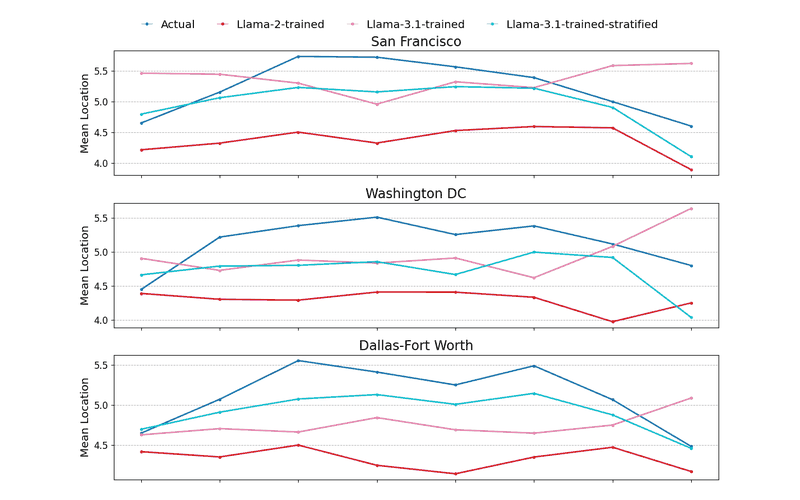
Age. The NHTS over-represents older adults compared with the census. Fine-tuning Llama-3.1 on a sample balanced by age and sex recovers the real “inverted-U” profile, where people in mid-life visit the most places, and cuts the age-profile error by 34% on average with almost no change in the city-level results.
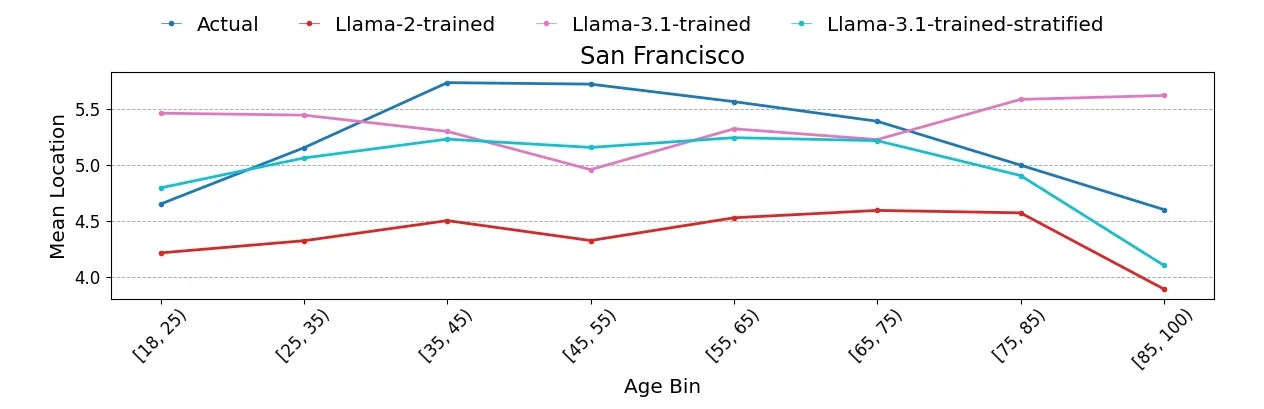
| City | Llama-2-trained | Llama-3.1-trained | Llama-3.1, age-balanced |
|---|---|---|---|
| San Francisco | 0.9189 | 0.6112 | 0.3527 |
| Washington DC | 0.9123 | 0.5651 | 0.5129 |
| Dallas–Fort Worth | 0.8704 | 0.5873 | 0.2635 |
| Los Angeles | 0.9252 | 0.6226 | 0.4321 |
| Minneapolis | 0.6573 | 0.5856 | 0.4148 |
| Mean | 0.8568 | 0.5944 | 0.3952 |
RMSE of mean places visited per age group against the real survey, lower is better (TSAS Table 10). The full-precision Llama-3.1 also beats the 8-bit Llama-2 by a wide margin here, a gap that city-level averages hide.
Seasons. The model is never told about the weather, yet its surveys rise and fall with temperature the way real ones do. The correlation between monthly temperature and monthly activity is 0.85 for generated data in New York (real: 0.83), 0.45 in Los Angeles (real: 0.22) and 0.57 in Dallas–Fort Worth (real: 0.37). In none of the six cities tested does the model invert the relationship.
Compared with a rule-based simulation
Against Patterns of Life, a conventional agent-based simulation, the LLM-generated surveys match the spread of places visited more closely, including the busy days in the tail, and reproduce more of the rare activity chains that the rule-based model never produces.
From surveys to simulation
Each synthetic diary here is a single independent day. UrbanLLMind turns the idea into a running city: persistent agents that plan, remember and react over a week, evaluated with the same three-level framework.