From Text to Maps
LLM-driven extraction and geotagging of epidemiological data
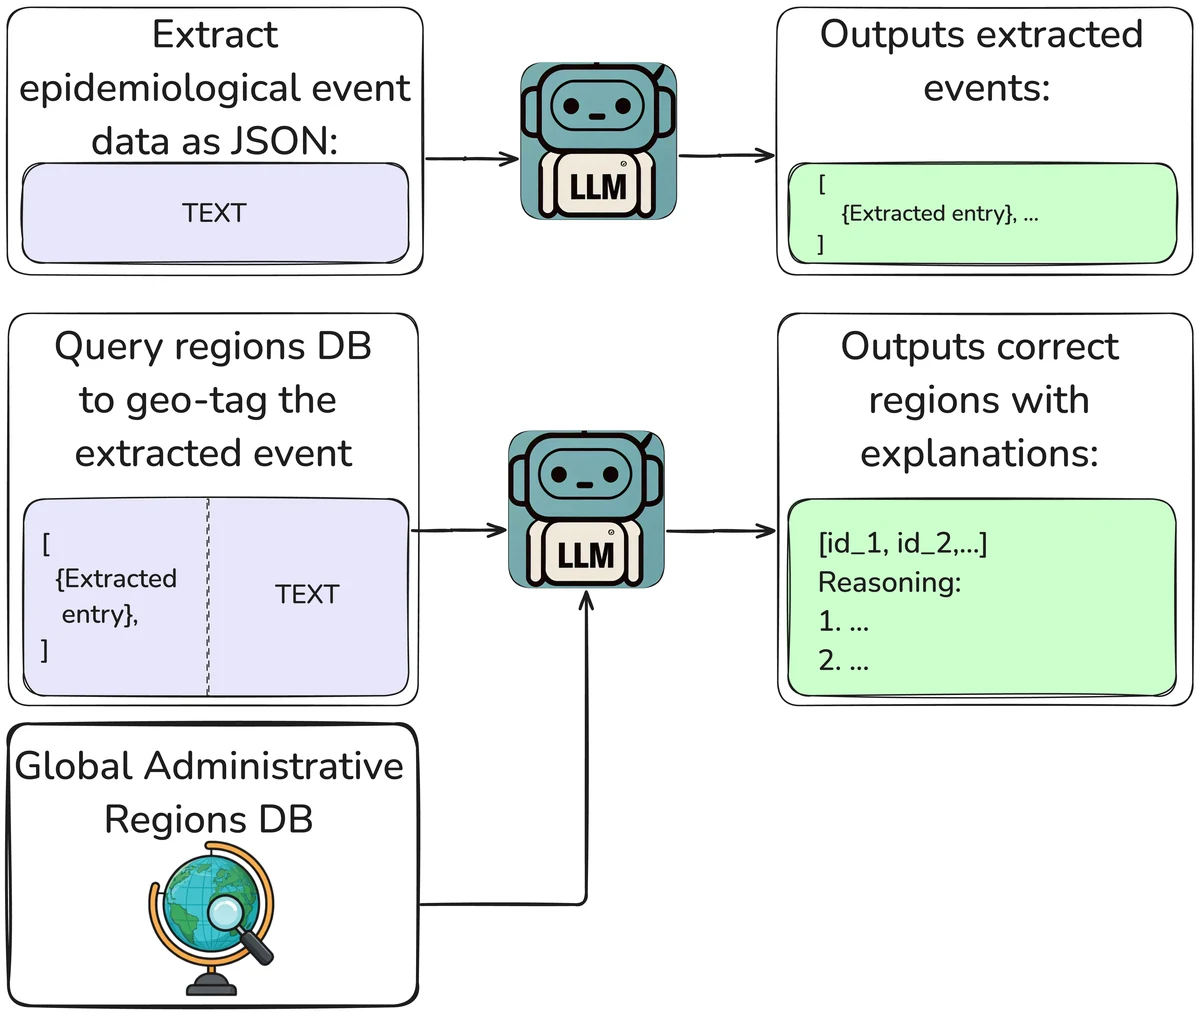
Data on where and when diseases break out are essential for public health, but they are scattered across decades of reports and research papers, written in different formats and languages, and tied to administrative boundaries that keep changing. Building a dataset usually means people reading every document, copying the numbers by hand and working out which district a place name refers to. We built a pipeline in which a large language model does the reading and the geotagging, and people only check its work.
Step 1 · Extract the records
We tested the pipeline on Rift Valley fever, a viral disease of animals and people, using the source documents behind an existing human-curated dataset of outbreaks in humans. The PDFs are converted to text with GROBID and split into sections; each section is sent with two neighbors on either side so nothing is cut off, and each one is processed five times with Llama-3.1 (8B and 70B). The prompt asks for JSON only:
Extract the occurrences of Rift Valley Fever globally on humans only, including specific
locations, outbreak dates, and epidemiological data. Adhere strictly to the provided text,
ensuring accuracy and faithfulness. Extract the information as a JSON with the following structure:
[
  {
    'location': <location_name>,
    'country': <country_name>,
    'disease_start_date': <YYYY/MM/DD>,
    'disease_end_date': <YYYY/MM/DD>,
    'number_of_cases': <INT>,
    'number_of_deaths': <INT>,
    … plus a confidence score (0–100) for each field
  }
]
Please keep in mind the following things:
1. Only extract information regarding Rift Valley fever and not other diseases.
2. Extract information regarding the outbreak of Rift Valley fever in humans only. Disregard
   information related to animals and seroprevalence.
…
5. Provide the case counts as the number of confirmed cases rather than the estimated or
   investigated ones
6. Provide the location name in as much detail as you can, meaning the lowest administrative
   region possible.
…
Below is the text to extract the information:
The answers are parsed, records without a location or without any dates or counts are dropped, duplicates are merged, and a record is kept only if its numbers can be found in the source text.
| Model | Kept if found in at least k of 5 runs | Precision % | Recall % |
|---|---|---|---|
| Llama-3.1-8B | 1 | 9.02 | 100.0 |
| Llama-3.1-8B | 2 | 11.44 | 100.0 |
| Llama-3.1-8B | 3 | 12.31 | 91.67 |
| Llama-3.1-70B | 1 | 19.82 | 100.0 |
| Llama-3.1-70B | 2 | 18.48 | 91.67 |
Measured against the human-curated dataset (Table 1 of the paper). Precision looks low because every record the humans did not have counts as wrong, including correct ones they missed.
The model finds every record the human annotators found. To see what the extra records were, we checked each one against its source text. 45% of the 70B model’s records were correct, which adds 25 correct records the annotators had missed: 45 in total against the human dataset’s 20. The pipeline was sometimes more careful than people, too. For South Africa in 2010, the human dataset lists 240 cases and the pipeline 241; the source report says 241, but one case was missing from its state-by-state table. Of the incorrect records, 40% described individual patients, which calls for clearer instructions rather than better extraction; 10% counted suspected rather than confirmed cases, and about 5% came from text-conversion errors in tables and page headers.
Step 2 · Put the records on the map
Each record names a place, but “Aleg Hospital Center” is not something a map understands. The second step gives an LLM (Gemini 1.5 Flash, chosen for its long context) the record, the passage it came from and the full GADM table of administrative regions for the country, and asks for the matching region IDs with step-by-step reasoning. The reasoning is what makes the answer quick to verify:
{ "inferred_gids": ["MRT.3.1_1"] }

Here's how we arrived at this GID:

1. Focus on the provided entry: We are specifically interested in the outbreak described in the entry:
   { "start_date": "2015-09-01", "end_date": "2015-11-07", "number_of_cases": "12", "country": "Mauritania", "location": ["Aleg Hospital Center"] }

2. Locate the relevant text: The text mentions "During the outbreak, 19 (61%) and 12 (39%) confirmed cases were admitted at Kiffa Hospital Center and Aleg Hospital Center, respectively." This directly links "Aleg Hospital Center" to the outbreak we're analyzing.

3. Match to GADM: The GADM table shows "Aleg" as a NAME_2 under the GID_2 "MRT.3.1_1".

4. No lower level: The text doesn't provide information about a more specific location within Aleg. Therefore, "MRT.3.1_1" is the most precise GID we can infer.
When the text does not say enough to pin a place down, the model falls back to a broader region, or lists all the candidate regions, rather than guessing. Checking the reasoning by hand, we found it generally sound.
The payoff is resolution. The human dataset records outbreaks by country; the pipeline places them in the provinces and districts where they happened:
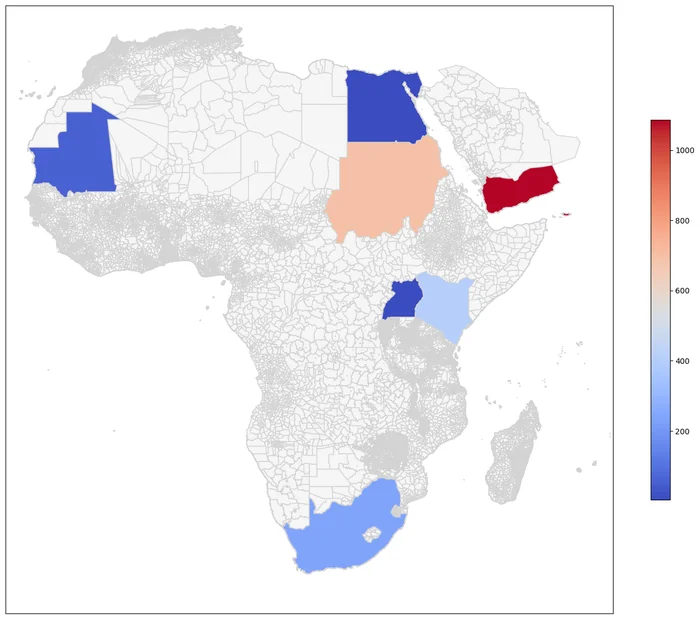
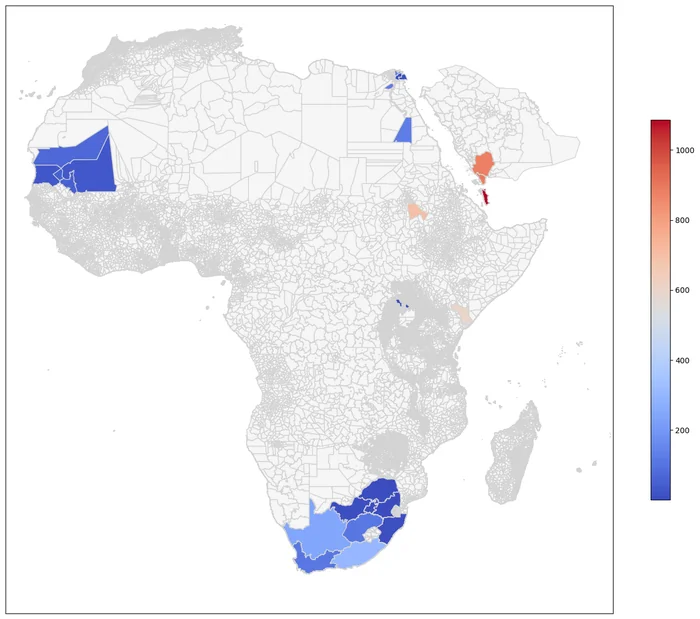
Rift Valley fever case counts (Fig. 2 of the paper).
Why it matters
The pipeline extracts more of what is in the documents, needs people only for checking, geotags at a finer resolution, and costs far less than reading everything by hand. Because the results feed public-health decisions, human review stays part of the method: every record links back to its source passage and every geotag comes with its reasoning, so errors and hallucinations can be caught. Next steps are more diseases, such as dengue, public datasets built this way, and multilingual models for reports that are not in English.